설명
WP Charts and Graphs plugin gives you a powerful chart generator on your WordPress admin. It is also allows you to see the chart immediately on the admin before you publish it. It is pretty simple, you specify the titles and the values, choose the chart type, then the plugin automatically generate the shortcode which you can include on any page or post.
Cross Browser Compatible, Responsive
The charts are responsive, the size depends on the container element. Therefore you can easily control the space that used by the graphs
Visual Builder, Live Preview
The admin area provides a generator with live preview. This way you will exactly see the chart before publish it on your pages or posts.
Different chart types
Currently you can use the Pie Chart, Polar Chart, Doughnut Chart, Radar Chart, Bar Chart and the Line Chart.
Do you need more?
Modal Survey for WordPress is a Premium WordPress Plugin to get your visitors feedback via a professional, attention-grabber poll. Provides unlimited surveys, questions and answers with embedding option. Various animations and Visual Builder helps you to design your own styled survey that perfectly fits to your website. Display the results simply with Plain Text, Progress Bar, Line Bar, Pie Chart, Bar Chart, Doughnut Chart, Line Chart, Polar Chart and Radar Chart formats. The integrated Shortcode Manager ensures you can quickly include the survey’s results to any page or post with only few clicks. Export your survey to PDF, XLS, CSV, JSON and XML
Features
- Responsive, Mobile-Friendly
- Chart generator
- Live Preview on admin
- Several chart types
Other Projects
스크린샷

Sample: California Senate Election Results 
Sample: Bitcoin Price Graph 
Sample: List of Countries by Net Oil Exports 
Generating the chart shortcode 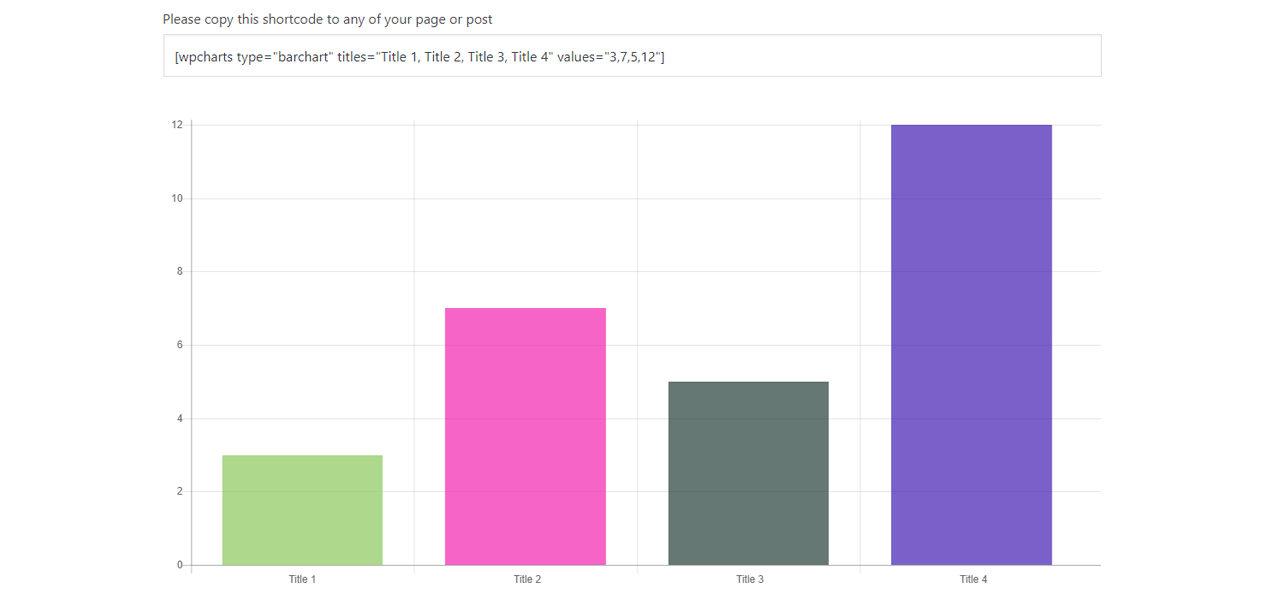
Live Preview on admin 
Editor view with included shortcodes
설치
- First, log in to the Administration area of your WordPress website and select Plugins.
- Click Add New on the top of the page
- Select Upload on the top of the page again
- Browse the plugin zip file from your computer and click Install Now.
- Click on the Activate Plugin link and the plugin will be active.
- After successful plugin activation, you will redirect to the plugins’ list page.
- You can find the WP Charts and Graphs plugin in the list or select it from your Settings admin navigation menu.
- Use the Chart generator to set the chart and include the shortcode to any of your page or post.
FAQ
-
How can I generate a chart?
-
Select the WP Charts and Graphs from your Settings admin navigation menu, then specify the titles and values and click on the Generate button. Copy the generated shortcode and paste to your page/post editor in text view.
-
Can I display more than one chart on the same page?
-
Yes, you can create unlimited charts.
후기
기여자 & 개발자
“WP Charts and Graphs – WordPress Chart Plugin”(은)는 오픈 소스 소프트웨어입니다. 다음의 사람들이 이 플러그인에 기여하였습니다.
기여자변경이력
1.2.2
- minor optimization
1.2.1
- minor code optimization
1.2
- code improvements
1.1.9
- admin area slightly changed/updated
1.1.8
- code optimization
1.1.7
- fixed black settings page issue
1.1.6
- added settings page
- added option to exclude or include specified pages only
1.1.5
- added option to set the minimum value
1.1.4
- fixed minor bug
1.1.3
- minor code optimization
1.1.2
- fixed chart size
1.1.1
- added option to set the chart colors
1.1.0
- minor security optimization
1.0.9
- added bubblechart
1.0.8
- added horizontal barchart
1.0.7
- CSS code optimization
1.0.6
- minor optimization on admin area
1.0.4
- improved admin chart
1.0.3
- improved charts on the frontend
- improved backend UI
- added settings page to the main admin navigation menu
1.0.2
- added option to turn ON or OFF legends on pie, polar and doughnut charts
- updated localization
1.0.1
- added option to set the maximum value on line, bar and radar charts
1.0
- First Release