설명
Map Visualizer allows users to import csv files, and to create a map out of them using the plugin’s interface.
After you have successfully imported (or created) a data source, you can visualise it on a map and add it to your posts/pages with a shortcode.
All shortcodes can be constructed easily through the plugin’s interface.
CSV File Format
In order for the CSV file to be imported successfully, its format must comply with the following rules:
-
The first row must contain all the Header names:
- If you use geographical coordinates, the headers of the first two column must be named “Latitude” and “Longitude” respectively.
- If you use addresses, the first column must be named “Address” and the plugin will geocode the data accordingly.
- If you wish to use polygons, the first column must be named “Polygon”. Format of polygon data should be of Well-Known Text.
-
The second row must contain the data type of each column:
- Available data types include “INT”, “FLOAT” and “TEXT”.
- For “Latitude” and “Longitude” headers, the data type to be used is “FLOAT”.
- For “Polygon” or “Address” headers, the data type to be used is “TEXT”.
shortcode format
The general format of this plugin’s shortcodes is [visualise]. Available attributes include:
- “file_name” : The name of the file imported you wish to visualise.
- “map” : The map type to be used for the visualization. You can choose between “Satellite” or “Streets” maps and the default one is “Streets”.
- “type” : Type of visualization. Either visualise your data as “polygon” or as “marker”. Default type is “marker”.
- “marker_type” : Choose between “simple marker” or “circle_marker” to be pinned on the chosen map. The default markers are “simple marker”.
- “category” : Header Name of your file, which will be used to differentiate the data based on the marker_type chosen.
- “colorant” : Color of circle_markers and polygons, used to differentiate the data.
- “circle_radius” : Radius of circle_markers. The default value is 5, and it is advised to stay between a 1-10 scale.
- “fill_opacity” : Level of opacity for circle_markers and polygons. The default value is 0.3, and it is advised to stay between a 0.1-1 scale.
- “center_point” : An Address for setting the initial center point of the map.
- “zoom” : Initial zoom of the map. Value 1 shows the entire world map and the default zoom used is 3.
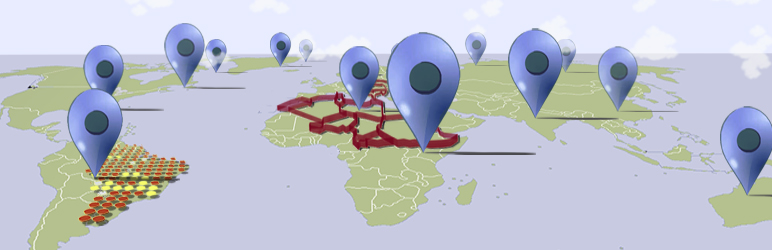
스크린샷

Simple Markers on a Google Street map

Circle Markers on a Google Satellite map

Polygons on a Google Satellite map
설치
- Upload the content of the ZIP archive to the
/wp-content/plugins/directory - Activate the plugin through the ‘Plugins’ menu in WordPress
- Import your file through the Import CSV File’ page. Alternatively create your own through the ‘Create New File’ page.
- View your stored files, construct and copy a shortcode through the ‘List All Files’ page.
- Paste the shortcode in the text where you want the map visualization to appear
FAQ
- What file formats are supported?
-
For now, only CSV files are supported. However, there is room for adding geojson or netCDF support on future versions.
- Is there a limit for the CSV file size?
-
Theoretically, no there isn’t. You should take into account, however, your hosting provider restrictions.
후기
이 플러그인에 대한 평가가 없습니다.
기여자 & 개발자
변경이력
1.0
*Initial Release